Selection of attributes
Generation of reports
Exemplary files
Datasets for feature selection (full version)
Below you can find the files containing full datasets for feature selection.
- methylation dataset, part 1methylation dataset, part 2methylation dataset, part 3
These three files ('methylation_data.7z.001', 'methylation_data.7z.002' and 'methylation_data.7z.003') have to be joined into one 'methylation_data.csv' file.
Datasets for feature selection (reduced version)
Below you can find the files containing reduced datasets for feature selection.
Dataset for report generation
Below you can find the files containing: input data (data after feature selection) for report generation and parameters of the conducted feature selection.
Generated reports
Below you will find generated reports.
MAINE is a web application that allows carrying out survival and classification analyses based on experimental, multi-omic patient data. It allows the user to perform two main types of analyses:
- Selection of the most important attributes (features)
- Survival and classification reports
Aleksandra Gruca, Joanna Henzel, Iwona Kostorz, Tomasz Stęclik, Łukasz Wróbel, Marek Sikora, MAINE: a web tool for multi-omics feature selection and rule-based data exploration, Bioinformatics, Volume 38, Issue 6, 15 March 2022, Pages 1773–1775, https://doi.org/10.1093/bioinformatics/btab862
- Selection of attributes
- Data files
- Patients follow-up information
- patient_id - representing unique patient identifier.
- outcome - this attribute supervises the feature selection process and provides the value of the primary class value (most important group of examples);
- survival_status - this column contains information about patient survival status (especially whether the so-called event was registered), if selected, this column can also supervise the feature selection process;
- survival_time - information about patient survival time related to survival event. This information can be taken into account further, for survival analysis in Generate reports part of the application.
- Additional data files
- Methylation data
- RNA-Seq data
- CNV data
- General settings
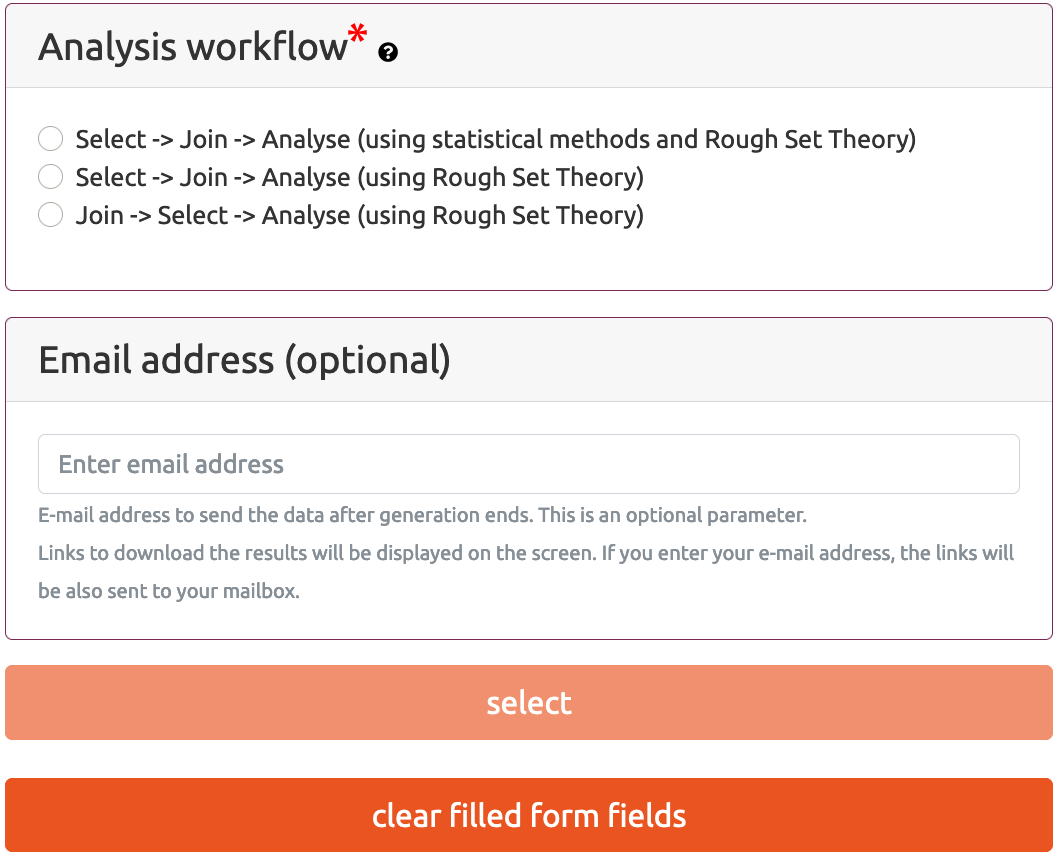
- Analysis workflow
- Select* -> Join -> Analyse (*using statistical methods and Rough Set Theory)
- Select* -> Join -> Analyse(*using Rough Set Theory)
- Join -> Select* -> Analyse(*using Rough Set Theory)
- Methylation – attribute selection using statistical method
- RNA-Seq – attribute selection using statistical method
- CNV – attribute selection using Rough Set Theory / Parameters for Monte Carlo Approximate Relative Reduct algorithm
- Results
- Generate report(s)
- Data files
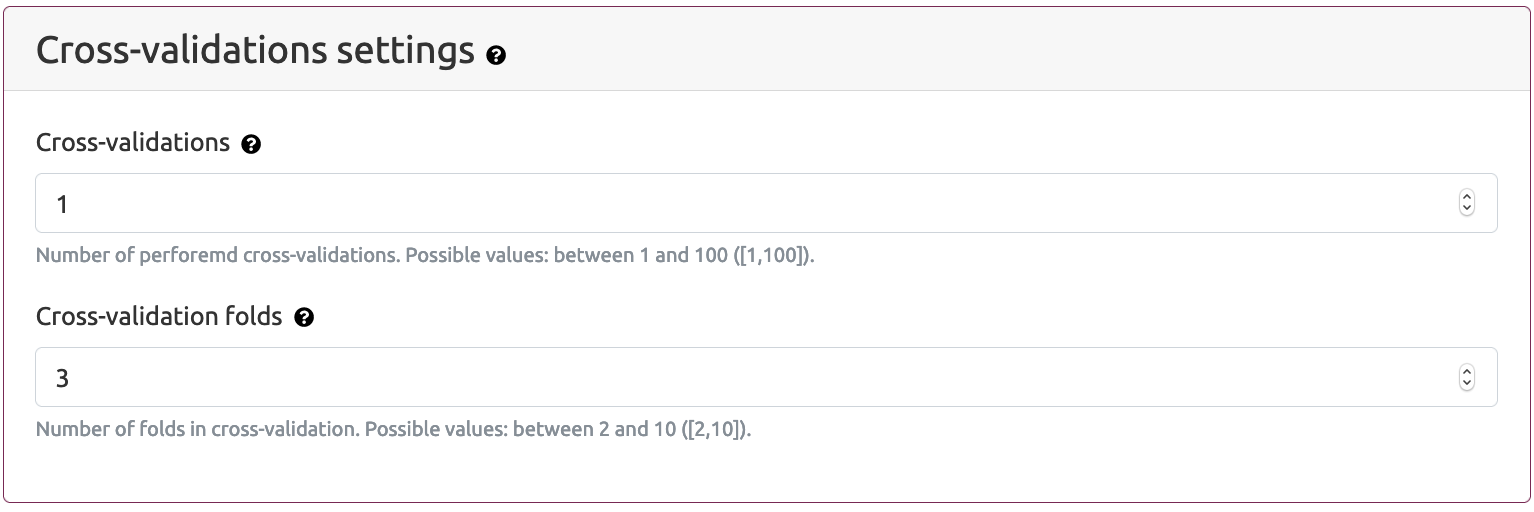
- Cross validations settings
- Cross validations - the number performed cross validations. If this parameter value is grater then one, then nested cross validation schema is applied.
- Cross validations folds - the number of folds (partitions) in each iteration of cross validation procedure.
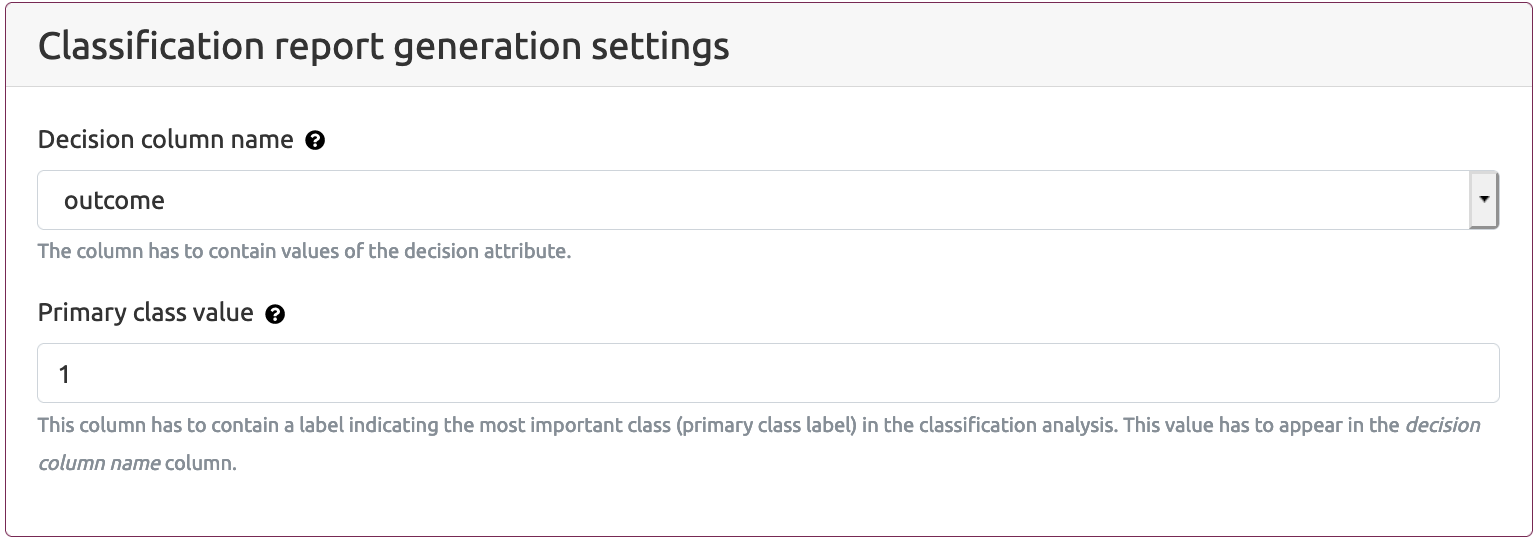
- Classification report generation settings
- Classification report generation settings
- Decision column name - the name of the column which includes decision attribute. The default value (as generated by the Selection of attributes part of the MAINE application) of this parameter is outcome
- Primary class value - the value which is assumed to indicate the most important class in the classification analysis (typically as a primary class we assume the value which is assigned to the group of the interest). The analysis workflow provided by the MAINE service assumes that there are only two groups: primary group and the others (secondary group). The primary group consists of patents with the Decision column name> value as indicated in Primary class value option. The secondary group consists of the rest of patients. The default value of a primary class is 1.
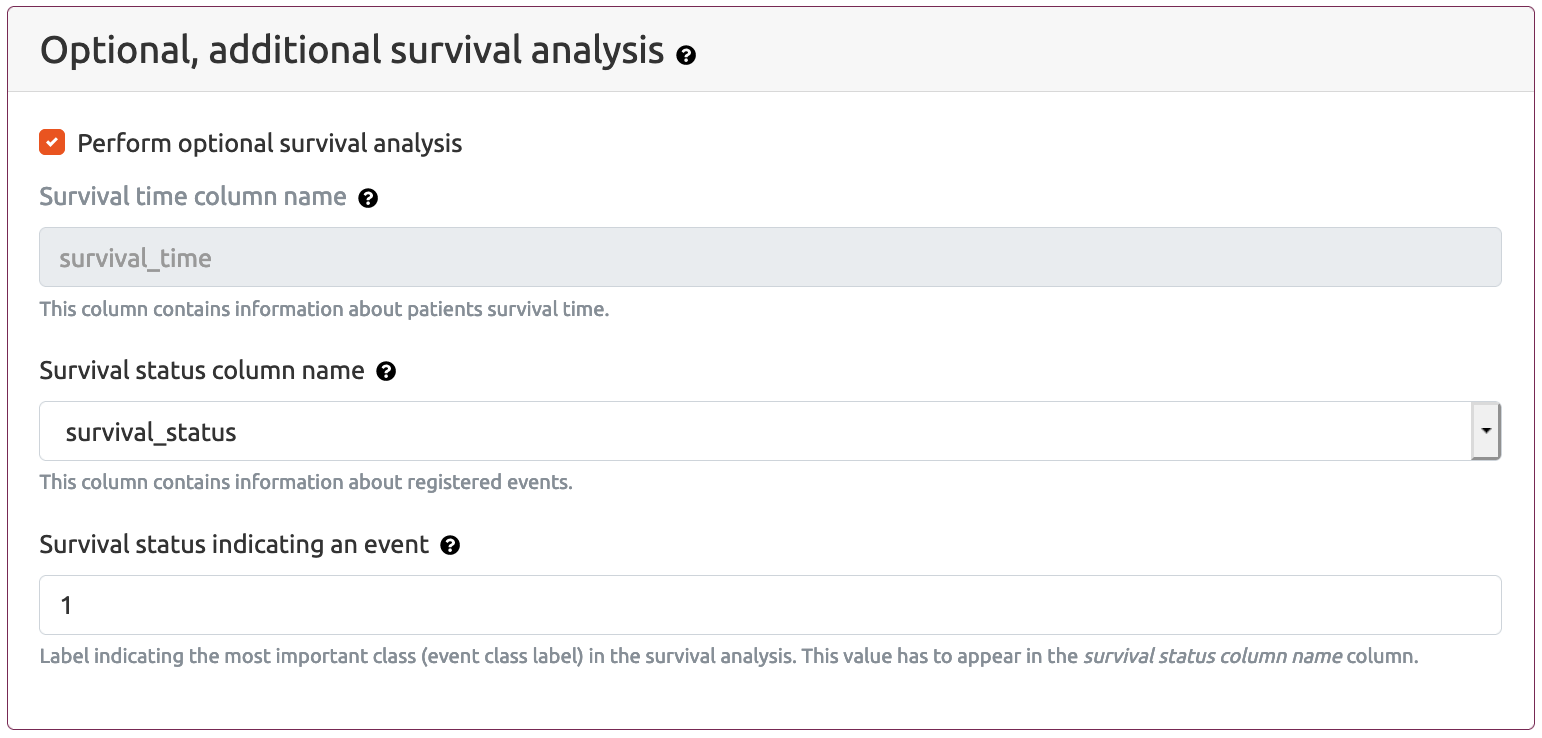
- Optional, additional survival analysis
- Survival time column name - this is a name (header) of the column that contains survival time. The name of this column is fixed and cannot be changed. This column typically includes values indicating number of days of survival or number of days to the last follow up.
- Survival status column name - the name (header) of the column that includes information about registered events. This can be either outcome or survival_status column.
- Survival status indicating event - this parameter provides the value indicating the most important class (event class label). This value has to appear in the column indicated in Survival status column name parameter.
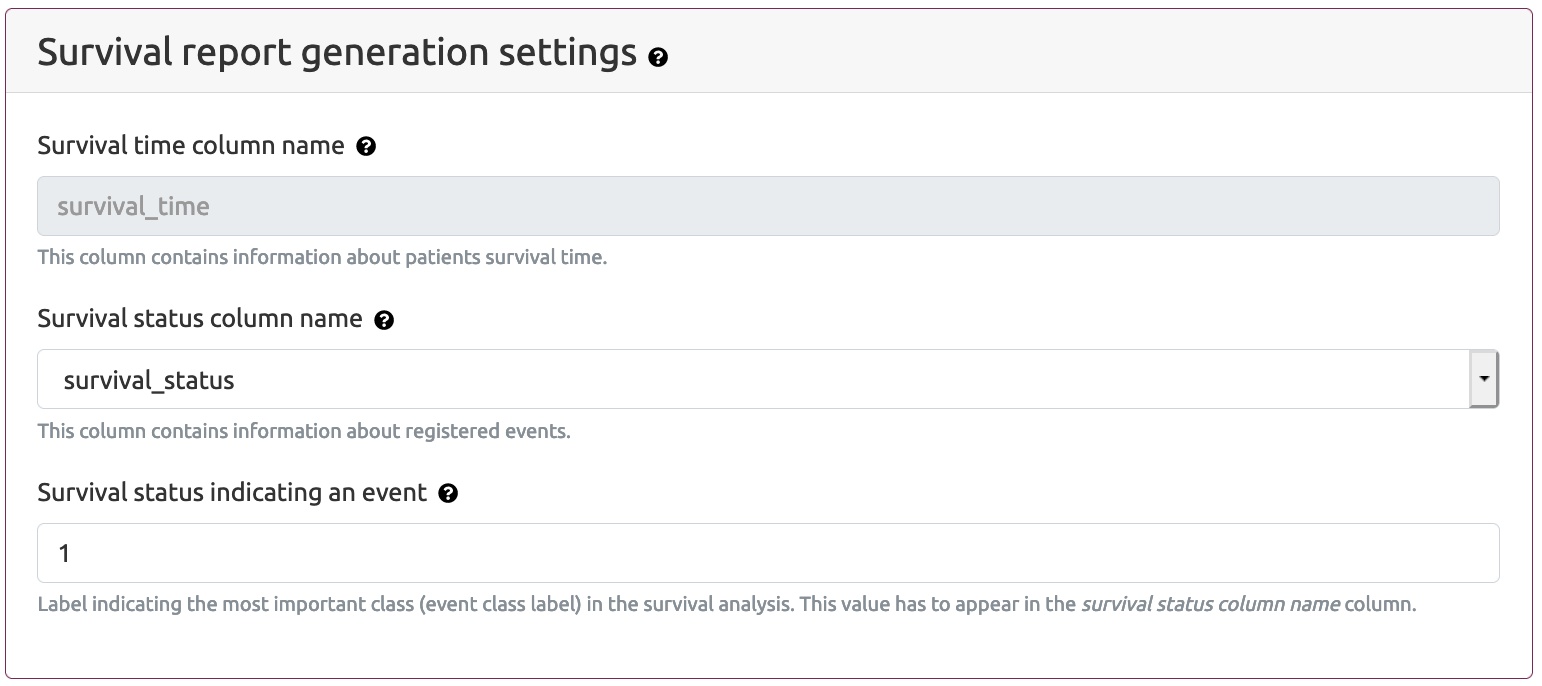
- Survival report generation settings
- Survival time column name - this is a name (header) of the column that contains survival time. The name of this column is fixed and cannot be changed. This column typically includes values indicating number of days of survival or number of days to the last follow up.
- Survival status column name - the name (header) of the column that includes information about registered events. This can be either outcome or survival_status column.
- Survival status indicating event - this parameter provides the value indicating the most important class (event class label). This value has to appear in the column indicated in Survival status column name parameter.
- Exemplary data
- Full datasets for selection
- Ilustrative (reduced) datasets
- methylation datset: 321,500 methylation probes for 109 patents
- rna dataset: 40,571 transcripts for 109 patents
- cnv dataset: 19,482 genes for 109 patents
- methylation datset: 48,229 methylation probes for 109 patents
- rna dataset: 6,068 transcripts for 109 patents
- cnv dataset: 2,922 genes for 109 patents
- References
- Robinson,M.D. and Oshlack,A. (2010) A scaling normalization method for differential expression analysis of RNA-seq data. Genome Biol., 11, R25.
- Gruca,A, Henzel,J., Kostorz,I., Stęclik,T. Wróbel,L. and Sikora,M. (2020) MAINE: web tool for Multi-omic feAture selectIoN and rule based data Exploration. Submitted
- Genomic and Epigenomic Landscapes of Adult De Novo Acute Myeloid Leukemia (2013) N. Engl. J. Med., 368, 2059–2074.
- Grossman,R.L., Heath,A.P., Ferretti,V., Varmus,H.E., Lowy,D.R., Kibbe,W.A. and Staudt,L.M. (2016) Toward a Shared Vision for Cancer Genomic Data. N. Engl. J. Med., 375, 1109–1112.
- Janusz,A. and Ślęzak,D. (2015) Computation of Approximate Reducts with Dynamically Adjusted Approximation Threshold. In Foundations of Intelligent Systems. Springer International Publishing, pp. 19–28.
- Ritchie,M.E., Phipson,B., Wu,D., Hu,Y., Law,C.W., Shi,W. and Smyth,G.K. (2015) limma powers differential expression analyses for RNA-sequencing and microarray studies. Nucleic Acids Res., 43, e47.
- Benjamini,Y. and Hochberg,Y. (1995) Controlling the False Discovery Rate: A Practical and Powerful Approach to Multiple Testing. J. R. Stat. Soc. Series B Stat. Methodol., 57, 289–300.
- Law,C.W., Chen,Y., Shi,W. and Smyth,G.K. (2014) voom: Precision weights unlock linear model analysis tools for RNA-seq read counts. Genome Biol., 15, R29.
- Robinson,M.D., McCarthy,D.J. and Smyth,G.K. (2010) edgeR: a Bioconductor package for differential expression analysis of digital gene expression data. Bioinformatics, 26, 139–140.
Selection of attributes is a part of MAINE application that allows the user to provide patient's follow-up data files with corresponding multi-omics measurements and to perform selection of the most interesting attributes related to the decision attribute provided in the follow-up file. Selection of attributes can be based on three different analysis workflows - depending on the choice of the user, different statistical methods and machine learning approaches are applied for analysis of submitted data.
Data files section allows the user to submit data files with multi-omics measurements and patient information (follow-up) file that include necessary information for classification and survival analysis.
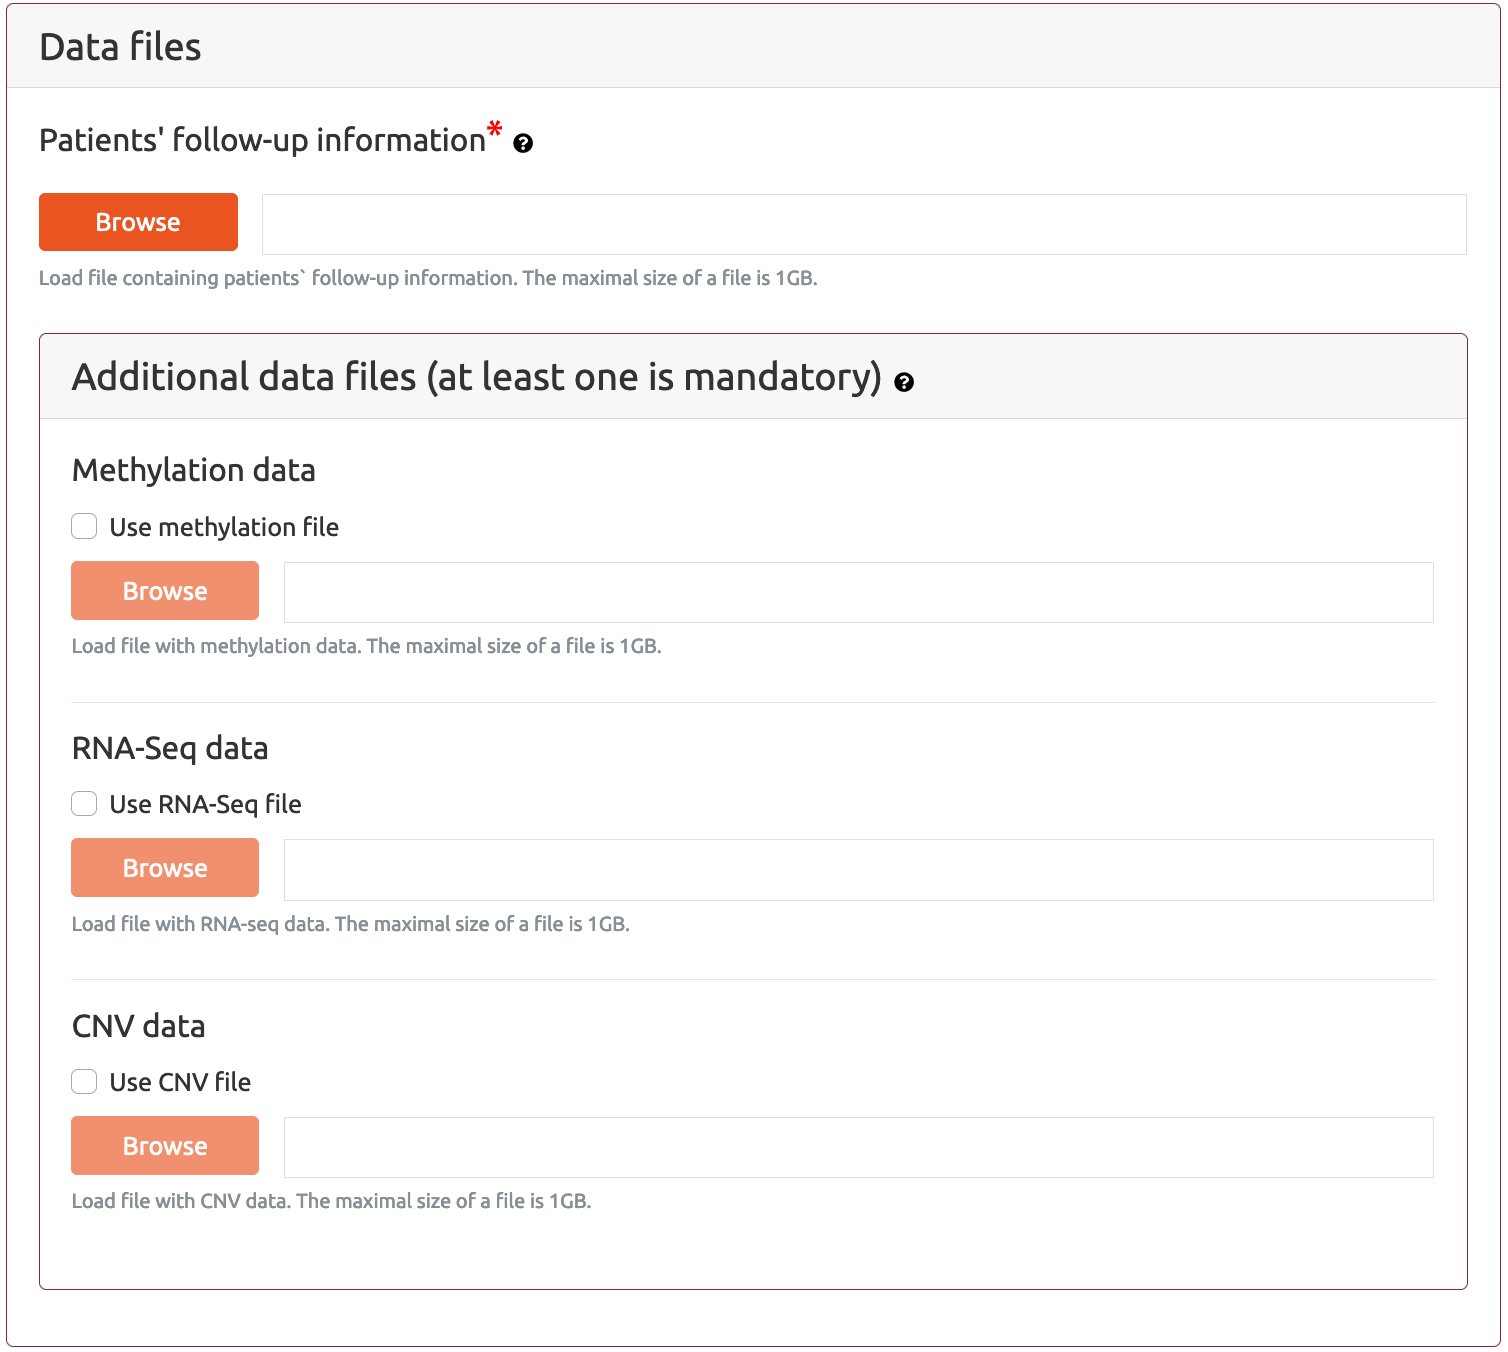
Patients follow-up information file includes list of the patients together with the information about the decision attribute value (for example information about the treatment outcome), survival status and survival time (used for survival analyses).
In particular, this is the file that links patient IDs into the outcome (decision attribute value) and (optionally) survival status and survival time. First row of in this file is assumed to be header.This file can include up to four columns with fixed names that have the following meaning:
The analysis workflow provided by the MAINE application assumes that a patient can belong to one of the two groups: group of interest or the others. Usually the group of interests indicates the most interesting examples (for example patients staying alive for a given (threshold) amount of time; patients for the so-called event (death or relapse) was registered). Therefore, during the feature selection process the user has to provide the name of the column which includes such information. This can be either outcome column or survival_status column and the name of this column can be defined by the user in General settings section which can be found below. Therefore, for the attribute selection process, at least one of those columns has to be included into Patients follow-up information file.
The user may provide up to three files with multi-omic patient data measurements: Methylation data file, RNA-Seq data file and CNV (copy number variance) data file for selection of the most important probes/transcripts/genes in each of the dataset. Providing at least one file with data multi-omic data is mandatory. By selecting checkbox next to each type of multi-omic data file the user is provided with a section which allows to define parameters for its corresponding type of analysis.
Each multi-omic file should be a tab separated text file in form of a table where each row represents a single patient and each columns represent measured value for a particular attribute type (probe, transcripts or gene). The first row in the data file should represent patient IDs and the first column should include identifiers of attributes. The number of rows should be consistent across data files as well as the order of the patients. Further, in this tutorial we will use a general term attributes describing any type of multi-omic measurements provided in data files.
Methylation data file should include real numerical values. For first data selection workflow (statistical methods for features selection) we assume that uploaded methylation data file is the file that includes a beta values of methylation probes measurements which are then normalized to M-values and then the selection of probes is based on statistical analyses according to the parameters selected by the user (see the Methylation – attribute selection using statistical method section below). For the second and third selection schema, no data pre-processing is performed before feature selection, therefore it is up to the user to upload a methylation data file which is preprocessed in correct manner.
RNA-Seq data file should include real numerical values. For first data selection workflow (statistical methods for features selection) we assume that uploaded RNA-Seq data file includes raw gene/transcript counts. Then the raw counts are normalized using TTM (trimmed mean of M-values) method (Robinson and Oshlack, 2010) and then statistical analyses are performed according to parameters selected by the user (see the RNA-Seq – attribute selection using statistical method section below). For the second and third selection schema, no data pre-processing is performed before feature selection, therefore it is up to the user to upload an RNA-Seq data file which is preprocessed in correct manner.
CNV data file is processed the same way for all selection schemes and this is expected to be a file that that includes binary information about the event of the changed copy number (value 1) or lack of such an event (value 0). It does not include quantitative information regarding changed copy numbers and also the direction (positive or negative copy number change).
The maximal size of a file that can be uploaded into MAINE system is 1GB.
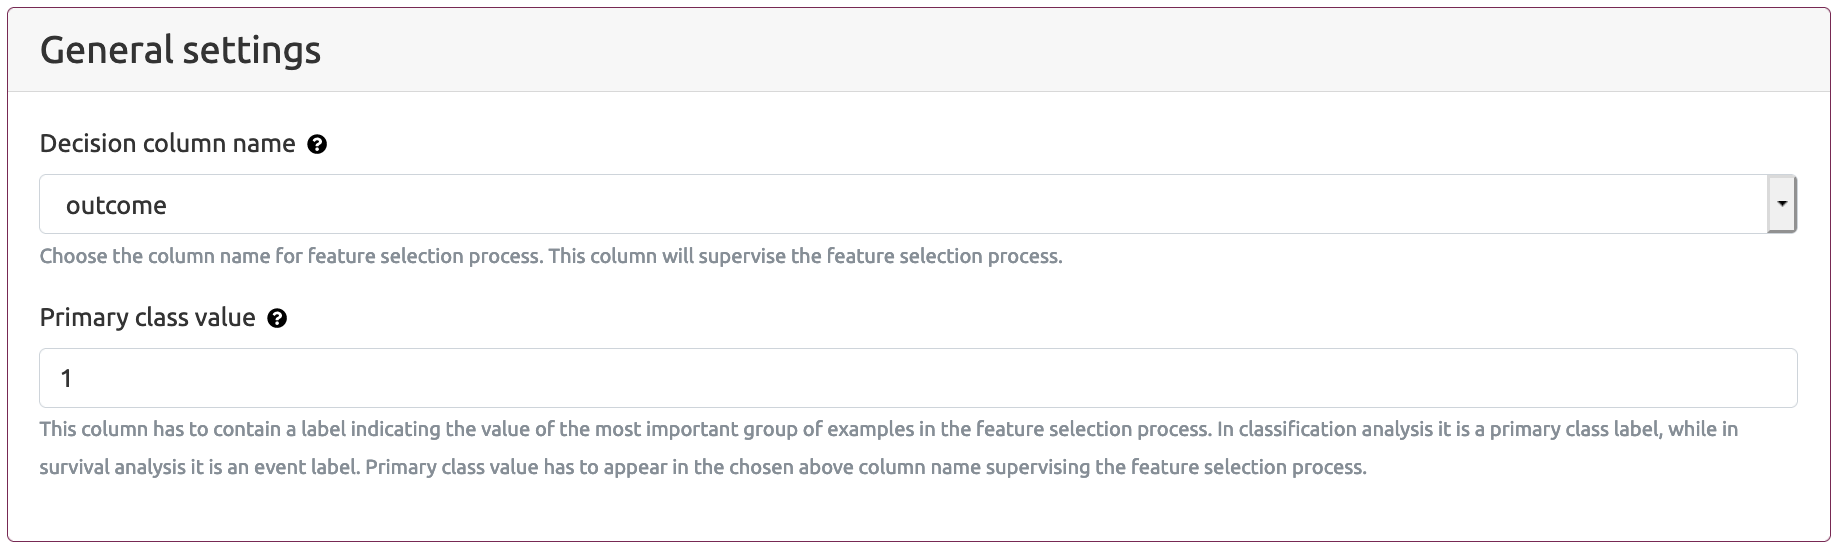
Decision column name parameter defines the name of the column that supervises the feature selection process (default value: outcome). This is the name of the column which have to appear in the header of the Patients follow-up information file. The header of this column is fixed and can be either outcome or survival_status.
Primary class value parameter indicates the value of the most important group of examples in the feature selection process. In classification analysis it is a primary class label, while in survival analysis it is an event label. Primary class value has to appear in the chosen above Decision column name supervising the feature selection process.
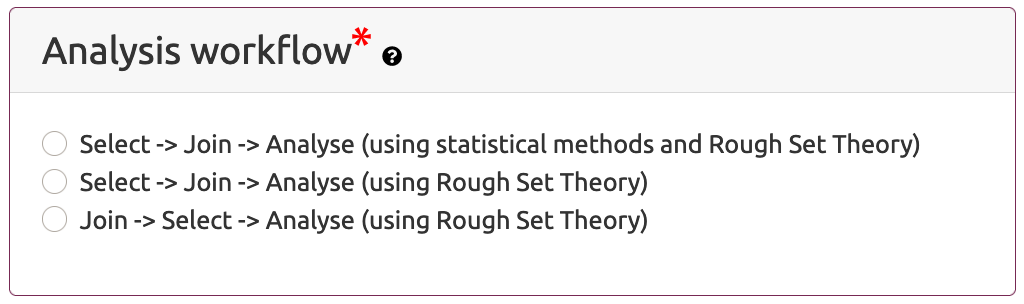
Analysis workflow section allows the user to choose the workflow which will be used to select the most important attributes that are related to the outcome of interest. The name of this attribute provided in Patients follow-up information file. Three analysis workflows are available.
In this mode the attribute selection process is carried out separately for each data type, using different methods depending on multi-omics data type. For methylation and RNA-Seq analyses, the attribute selection is based on statistical linear models from Limma (Ritchie et al., 2015). CNV attribute selection is based on Monte Carlo Approximate Relative Reduct (MCARR) calculation method (Janusz and Slezak, 2015) which is based on Rough Set Theory (RST)*. After the selection process, all attributes are joined together into a single table which is a base for further analyses.
The general description of the elements of this workflow is presented in the Figure 1.
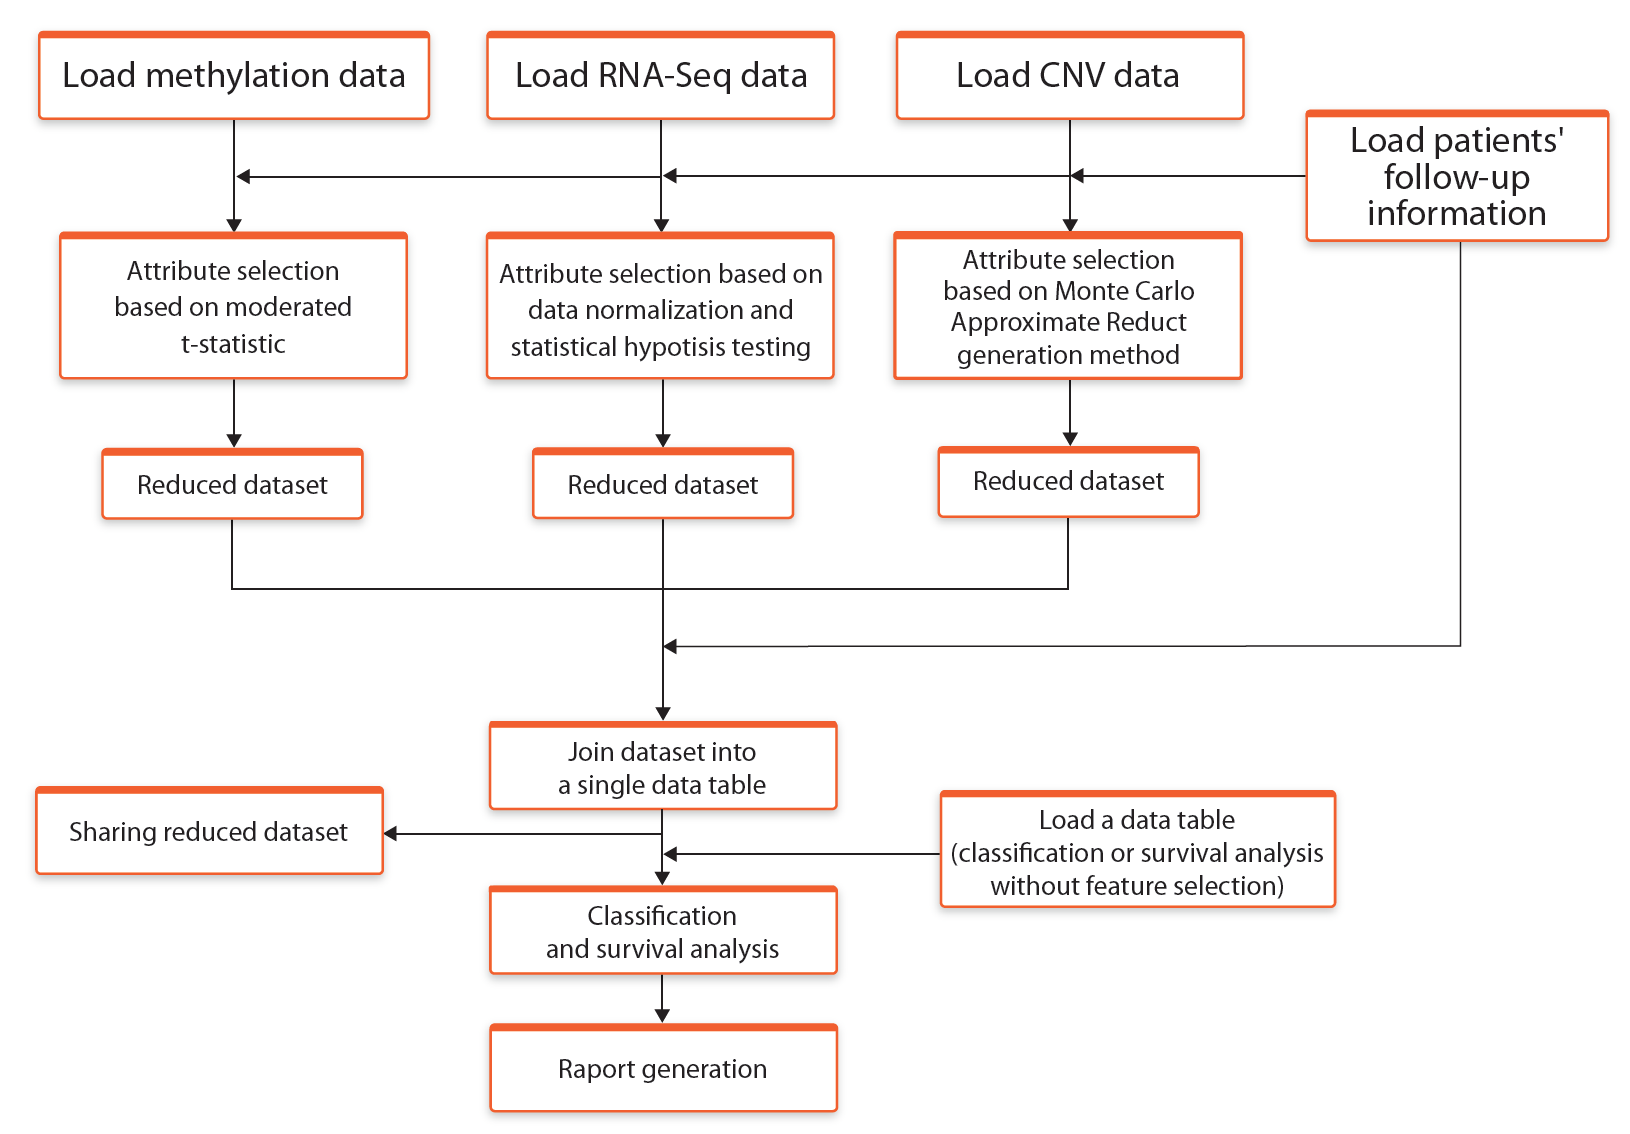
Fig. 1. Schematic representation of the workflow Select* -> Join -> Analyse (using statistical methods and RST)
In this mode the attribute selection process is carried out separately for each data type using Monte Carlo Approximate Relative Reduct approach. After the selection process, all attributes are joined together and a single table with all attributes is provided for further analyses. The general description of the elements of this workflow is presented in the Figure 2:
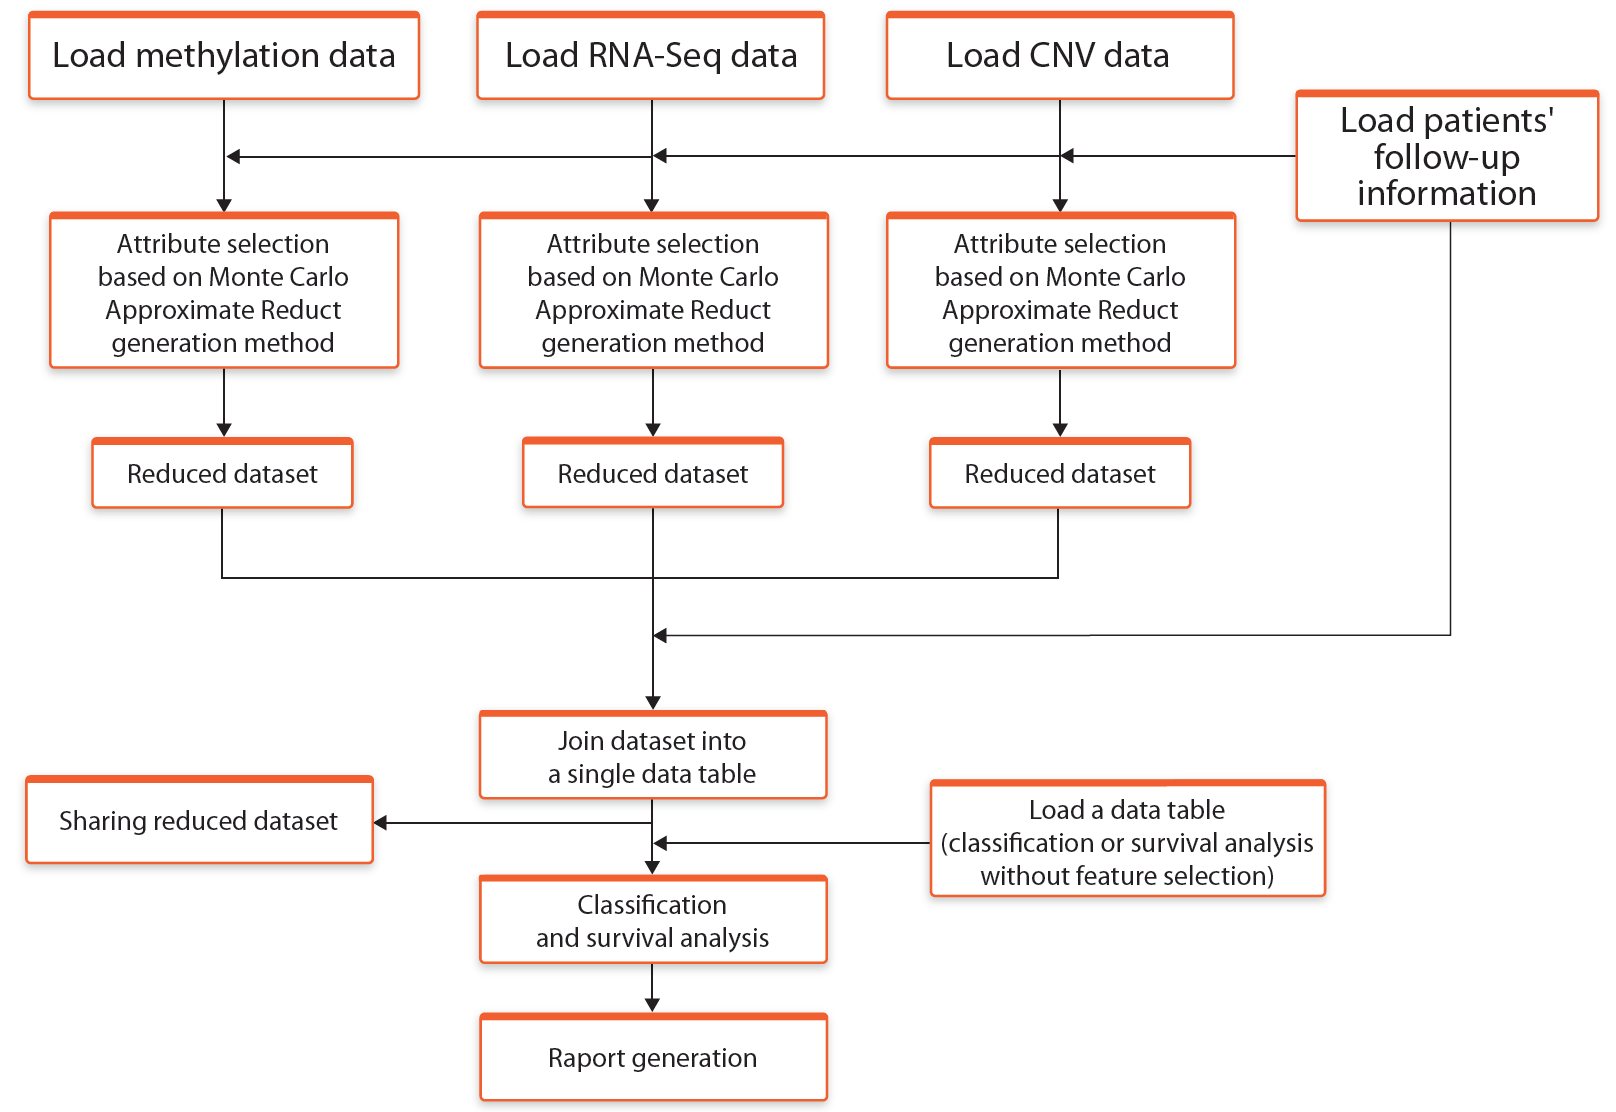
Fig. 2. Schematic representation of the workflow Select* -> Join -> Analyse (*using Rough Set Theory)
Here, unlike the previous modes, in the first step all attributes are combined into a single table and then the attribute selection process is performed. After the selection process, a joint table with all attributes is provided for further analyses. The general description of the elements of this workflow are presented in the Figure 3.
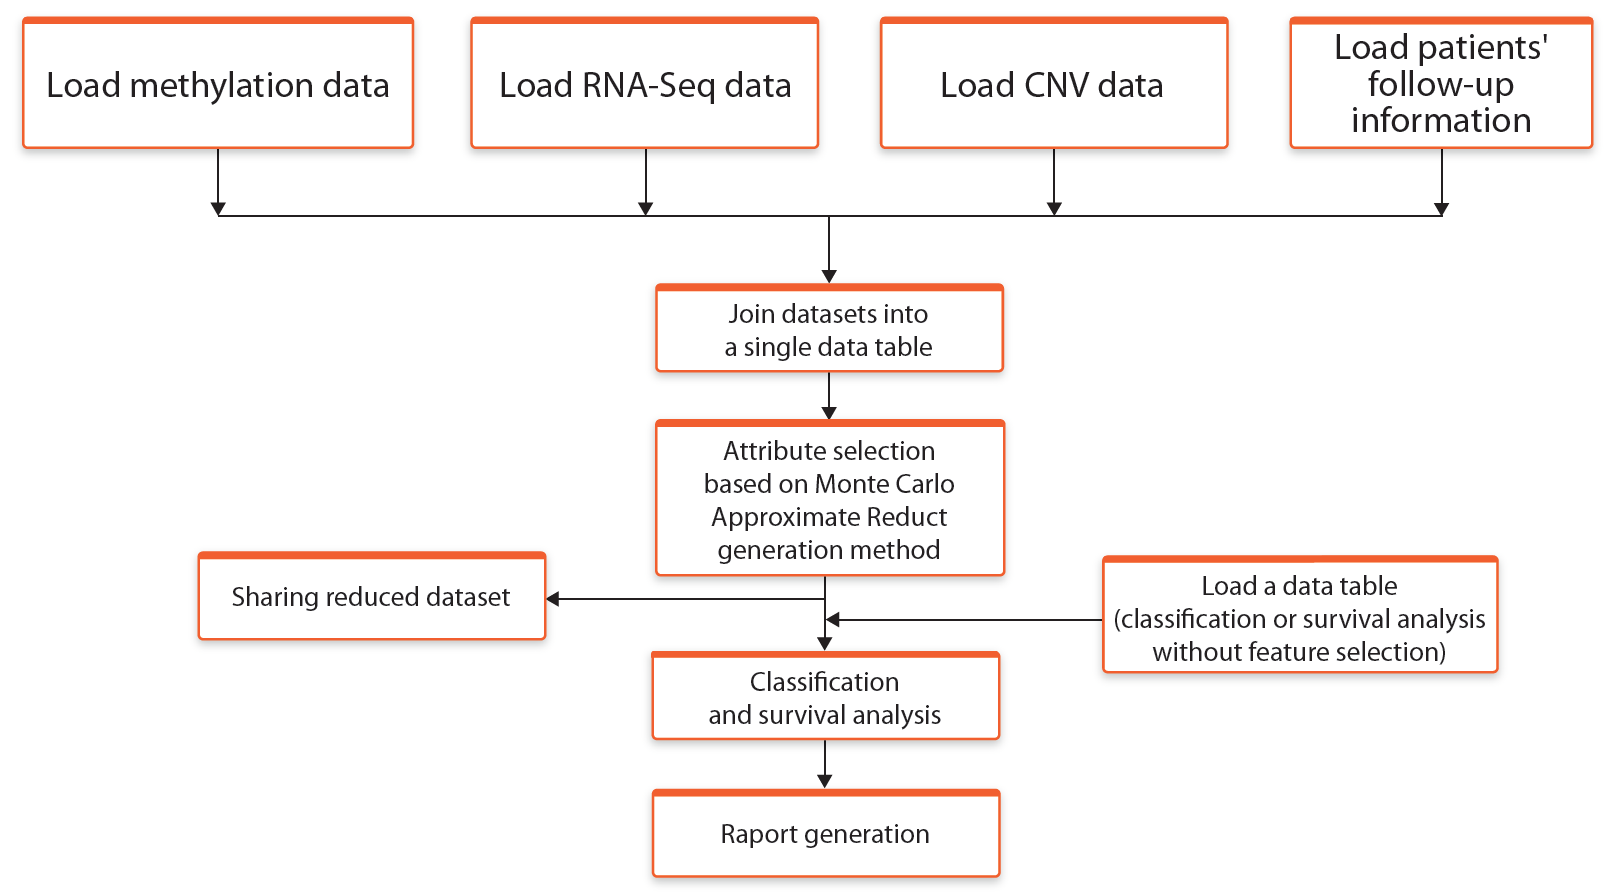
Fig. 3. Schematic representation of the workflow Join -> Select* -> Analyse (*using Rough Set Theory)
*Rough Sets Theory (RST) is a mathematical approach for reasoning under uncertainty. RST allows defining a rough approximation of crisp sets (i.e. conventional sets) in terms of a pair of sets which give the lower and the upper approximation of the original set. To learn more about basic principles of the Rough Sets Theory please check the following materials:
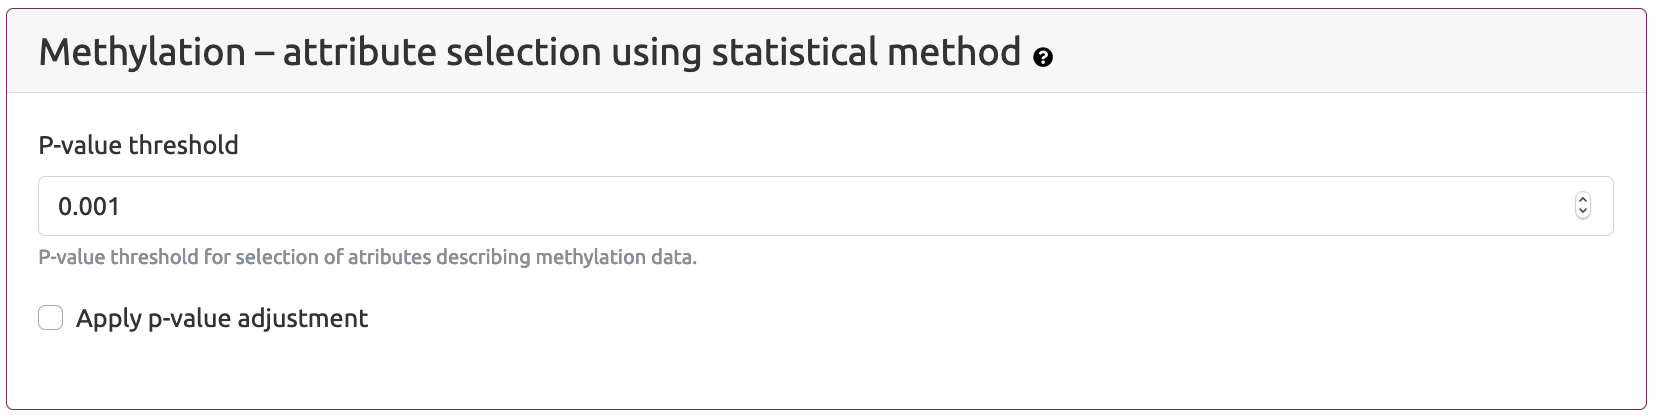
This section is available only if the user selects Select -> Join -> Analyse (using statistical methods and Rough Set Theory) workflow in the Analysis workflow section.
Selection of differentiating probes is based on empirical Bayes moderated t-statistics from limma R/Bioconductor software package and in this section the user can provide p-value threshold for moderated t-statistic. In addition, it is possible to select Apply p-value adjustment option which allows the user to provide Adjusted p-value threshold for Benjamini - Hochberg false discovery rate (Benjamini and Hochberg, 1995).
The process of methylation data normalization and selection of differentially expressed probes is presented in the Figure 4.
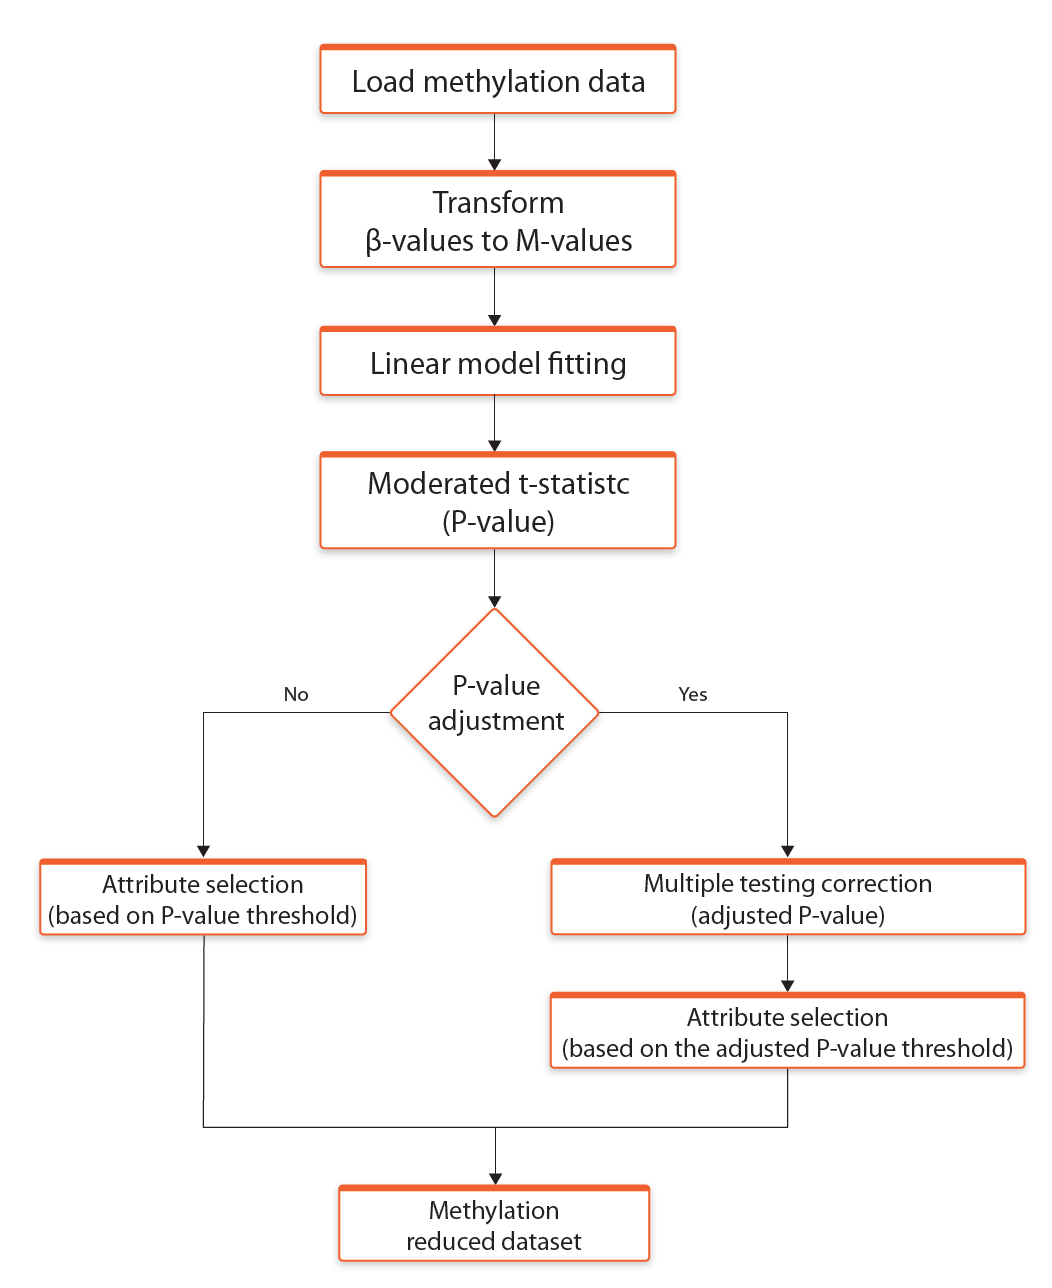
Fig. 4. Schematic representation of methylation data normalization and selection of differentially expressed probes
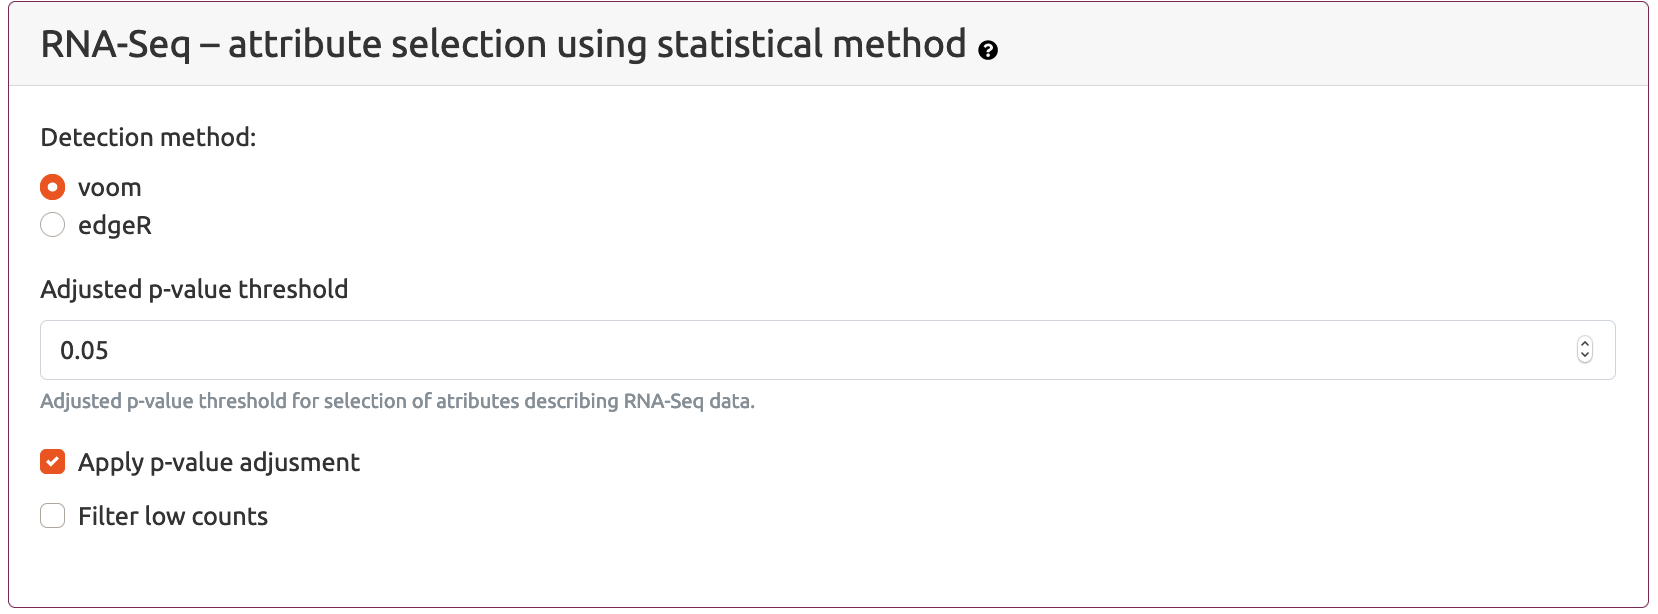
This section is available only if the user selects Select -> Join -> Analyse (using statistical methods and Rough Set Theory) workflow in the Analysis workflow section.
The user can select between two methods for RNA-seq data normalization: voom (Law et al., 2014) and edgeR (Robinson et al., 2010). Both methods are based on statistical models from limma R/Bioconductor software package. For both of them it is possible to define p-value threshold parameter for selection of differentially expressed genes. If Apply p-value adjustment checkbox is selected, then provided p-value is assumed to be a threshold for Benjamini - Hochberg false discovery rate.
In addition the user can select Filter low counts parameter which removes from analyses the reads with a very low counts per million reads. The removal of the reads is performed before the start of the the normalisation procedure.
The process of RNA-seq data normalization and selection of differentially expressed genes is presented in the Figure 5.
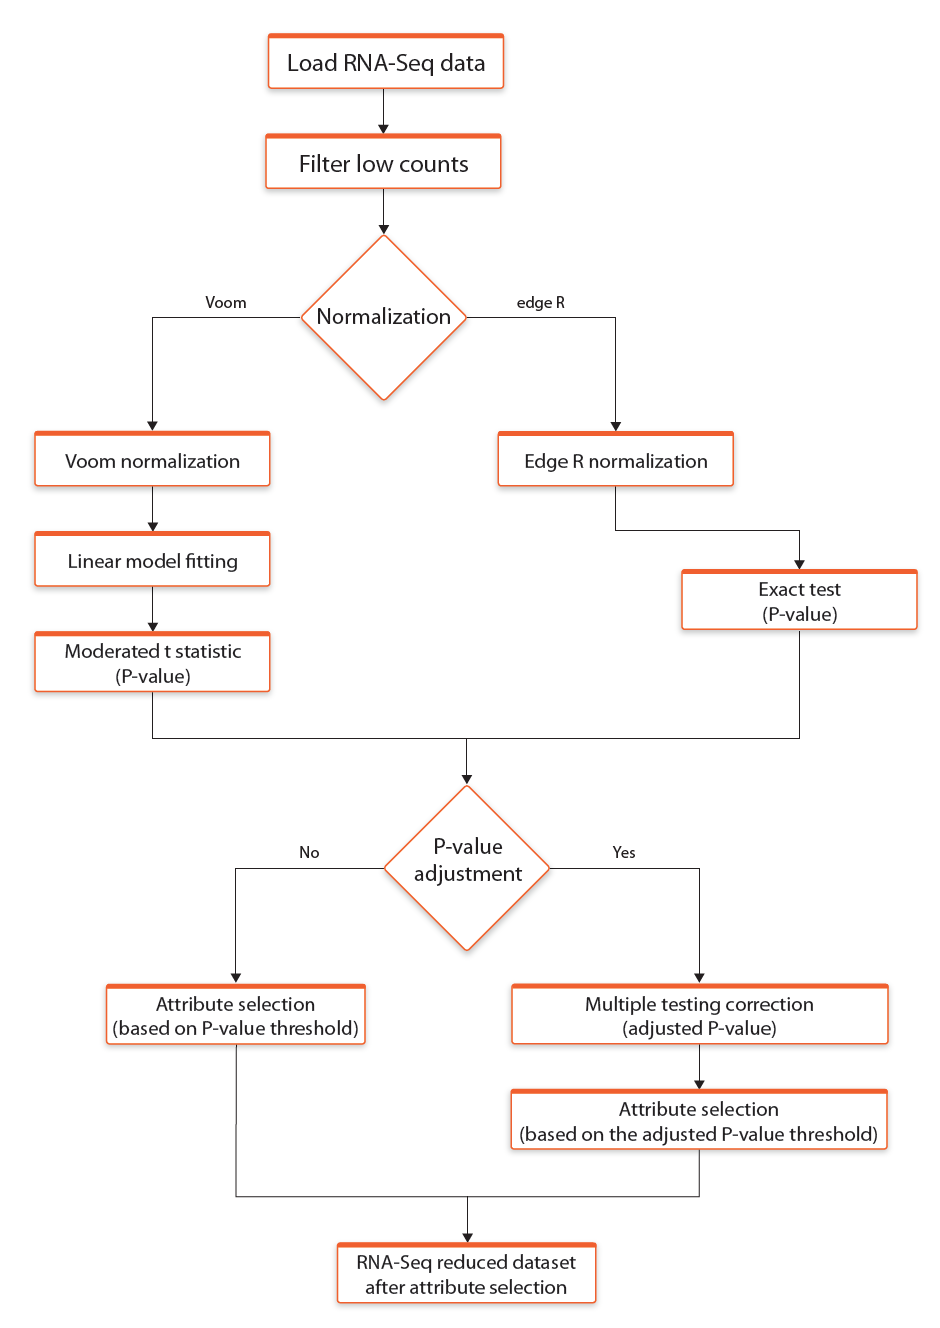
Fig 5. Schematic representation of RNA-seq data normalization and selection of differentially expressed genes
CNV - attribute selection using Rough Set Theory/Parameters for Rough Set method section is available while schema Select -> Join -> Analyse (using statistical methods and Rough Sets Theory) is selected. The same set of parameters for Rough Set Theory method is also available for schemas Select -> Join -> Analyse (using Rough Set Theory) and Join -> Select -> Analyse (using Rough Set Theory)
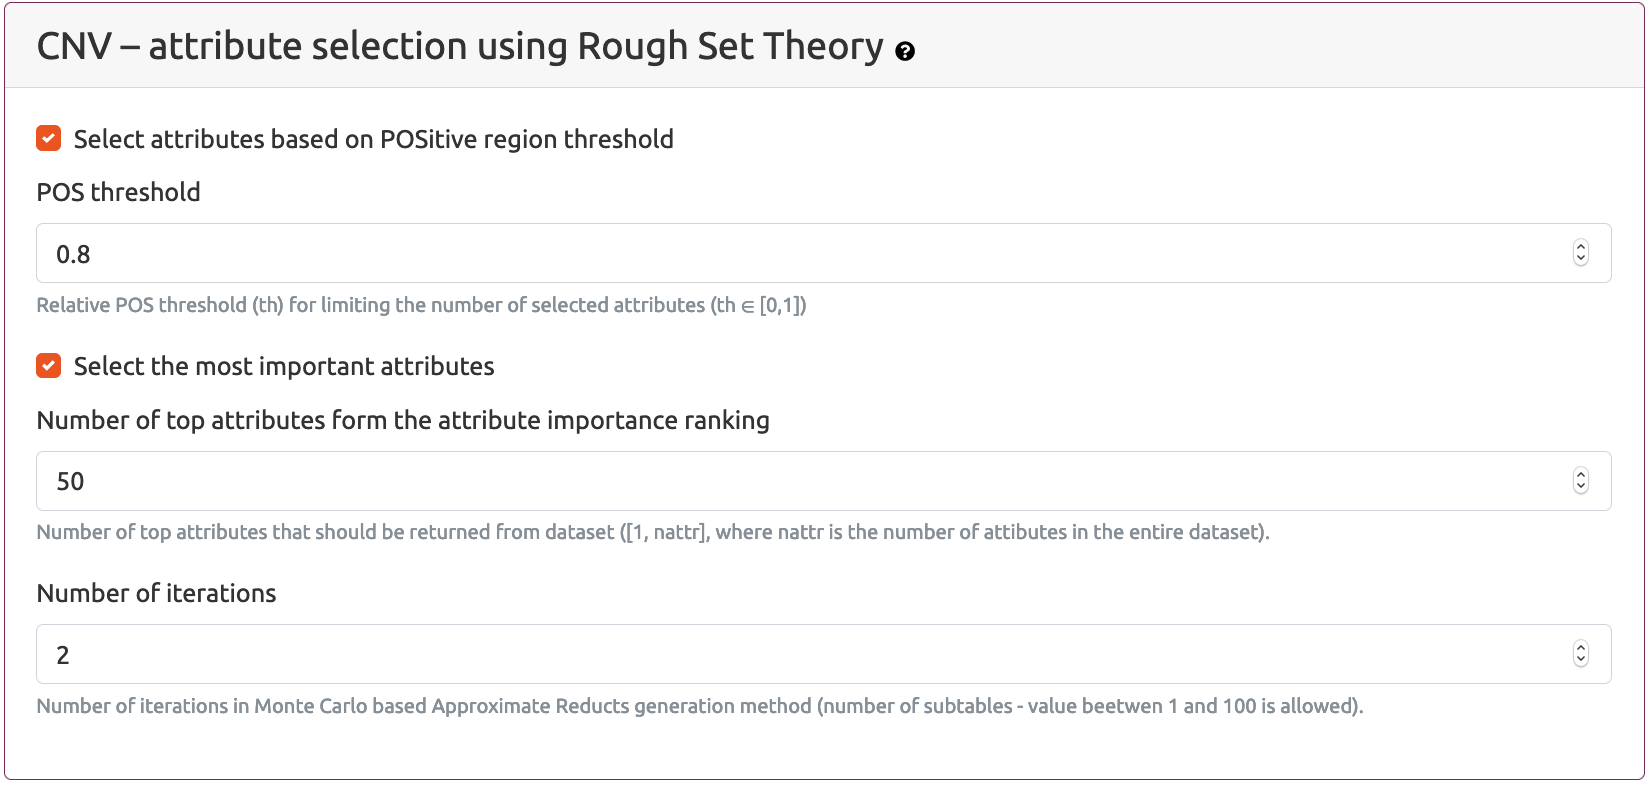
Selection of most interesting CNV attributes is based on Monte Carlo Approximate Relative Reduct (MCARR) calculation approach. Two complementary approaches can be used to limit the number of selected attributes:
Select attributes based on POSitive region thresholdand/orSelect the most important attributes
POS (POSitive) region of a dataset is a percentage of patients that can be uniquely assigned to a primary group based on the multi-omics data measurements (for example, if there are two patients with exactly the same values in decision column and one of them is assigned to a primary group and the other one is assigned to a secondary group, then this patients will not be included into POS region)
If the first, Select attributes based on POSitive region threshold option is selected, then the user can provide the value of the POS threshold parameter which is a percentage of the POS region for the whole dataset. Generally, the higher the POS threshold value, the higher the number of selected attributes which at the same time gives the better ability of the selected attribute set to discern between examples representing different groups of patients.
The second option Select the most important attributes allows the user to provide the exact number of the best (top) attributes selected during Monte Carlo iterations by MCARR algorithm. Attribute importance ranking is based on the set of calculated relative reducts.
Number of iterations parameter defines the number of Monte Carlo iterations.
The process of selection most interesting attributes based on Monte Carlo Approximate Relative Reduct calculation method is presented in the Figure 6.
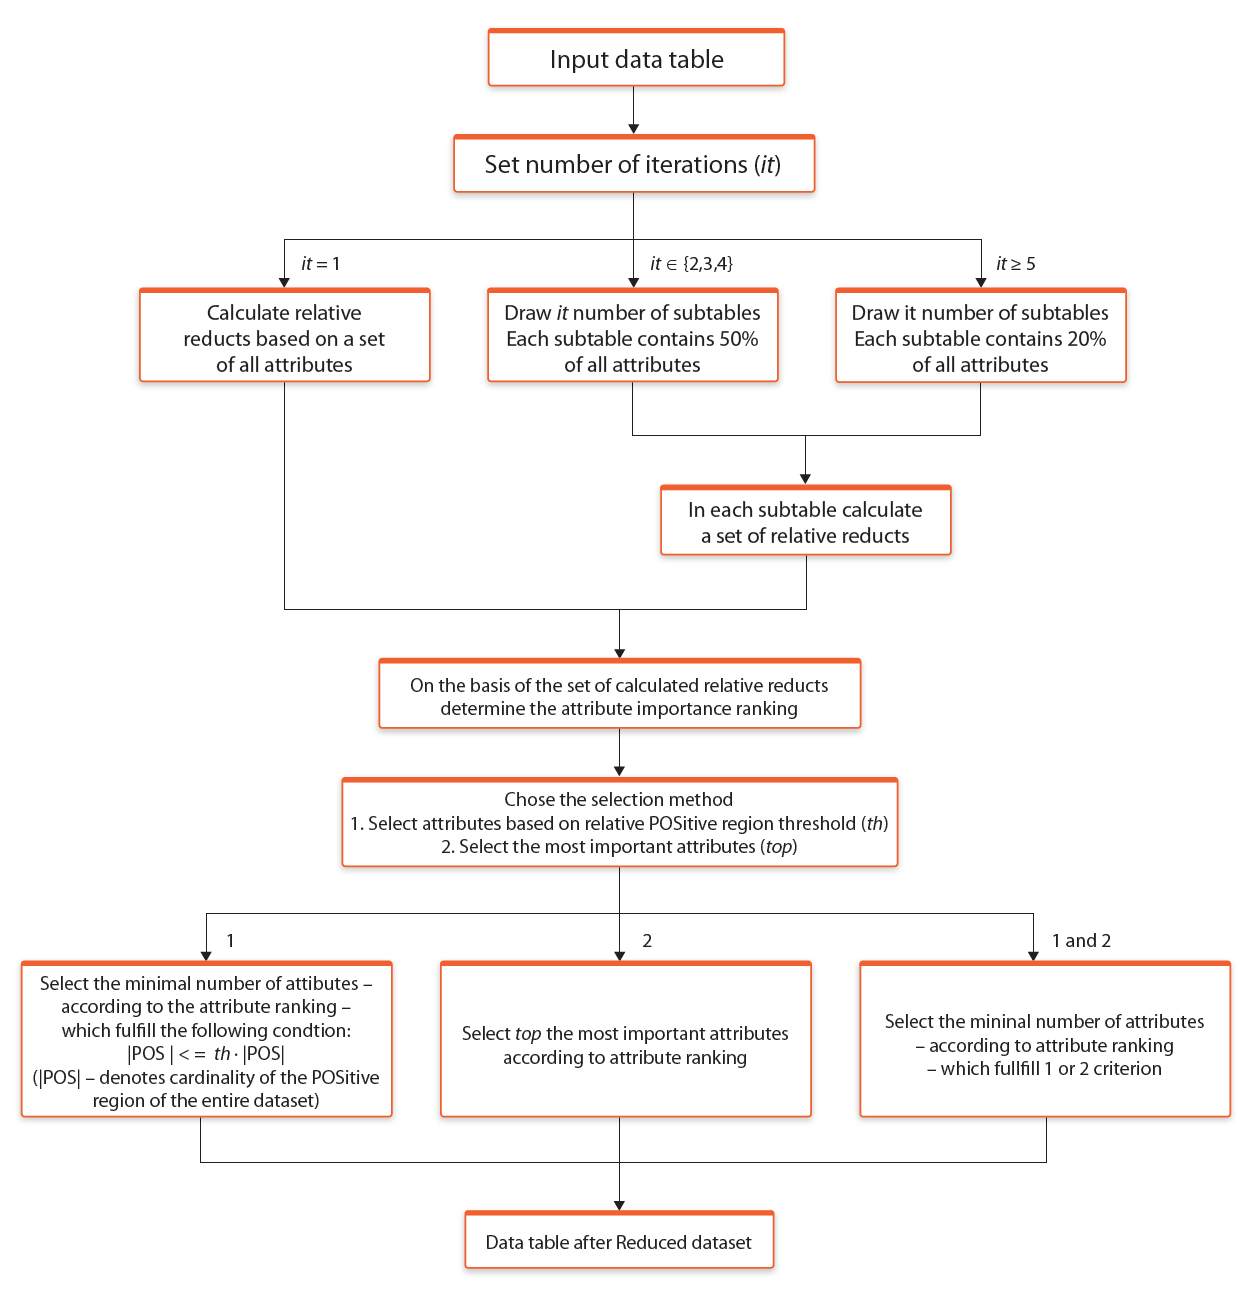
Fig. 6. Selection of most interesting attributes based on Monte Carlo Approximate Relative Reduct calculation approach
The result of the attribute selection process performed by the Selection of attributes part of the MAINE application is a tab separated text file in a form of a table, in which rows represent patients and columns represent selected attributes. Selected attributes from all types of multi-omics data are combined together into a single text table. To distinguish information coming from different data sources, the name of each selected attribute is extended with a prefix representing multi-omics data type. Attributes coming from methylation data file are extended with met_ prefix, attributes from RNA-Seq data file are extended with rna_ prefix and attributes from copy number variance data file are extended with cnv_ prefix. Last column(s) in the output data table are based on the information provided in patients' follow-up information file. Depending on the information submitted by the user, this may be one or more of the following columns: outcome and/or survival_status and survival_time.
It is possible for the user to run only the Selection of attributes section or, if interested in interpreting already existing set of attributes, only the Generate report(s) section. However, the typical use case of the MAINE application is to first perform the attribute selection and then generate classification or survival descriptive models.
Generate report(s) is a part of MAINE web application that allows the user to generate classification or survival reports based on the provided data files. As the result, the user obtains downloadable explanatory reports describing important discovered dependencies between selected attributes that are relevant to the decision attribute value prediction (classification reports) or patient survival status (survival analyses).
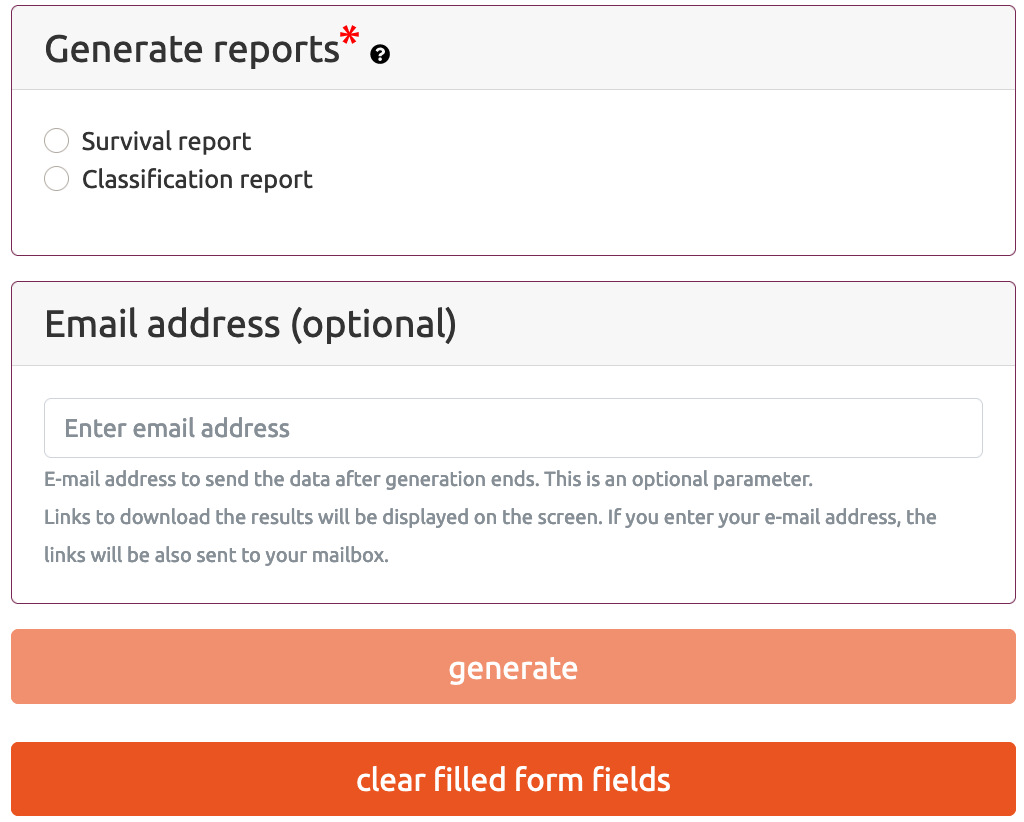
Data files section is common for both types of reports and allows to user to provide patients data file with selected features and optional text file that includes parameters that were used for attributes selection.
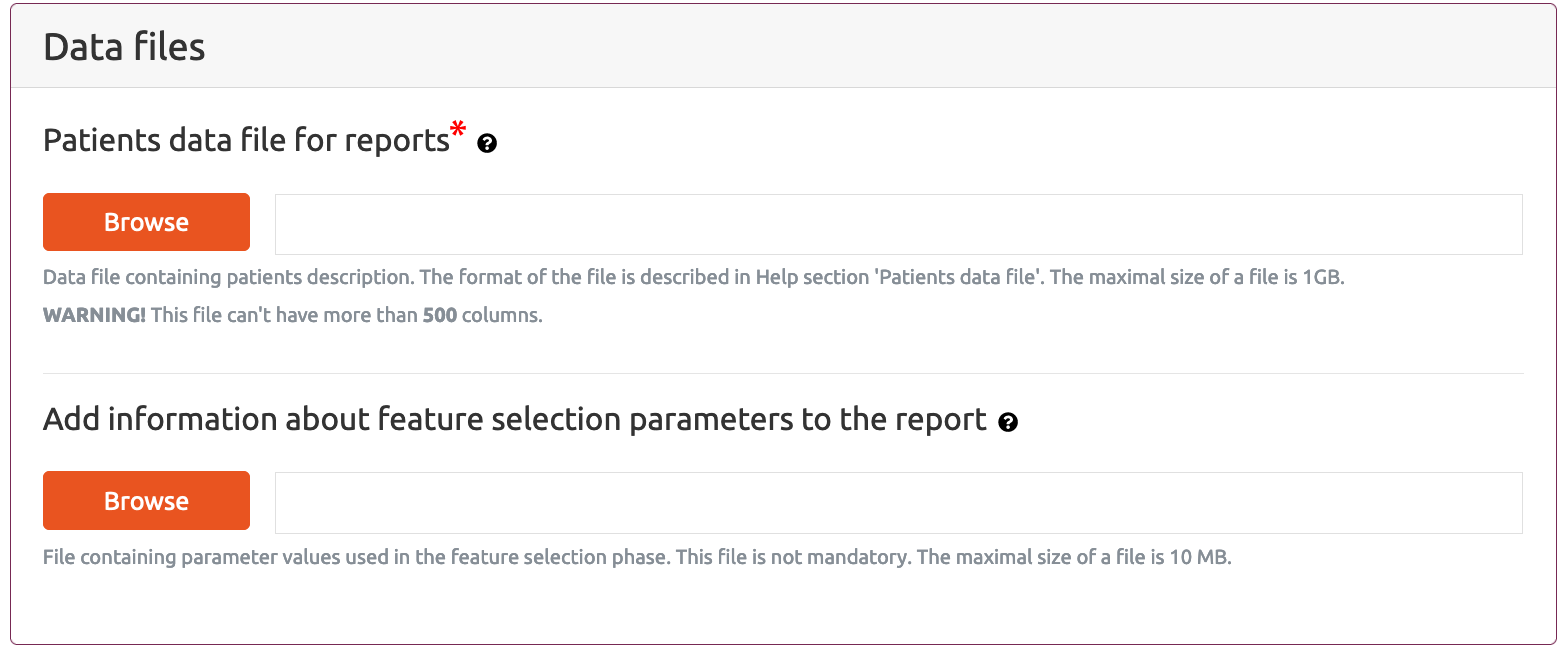
Patients data file for reports is the main data file that includes analysed data with reduced features on basis which the classification or survival reports are generated. It can be in any text file that includes data in the required format, however, the most common scenario of using this part of the MAINE application is to generate classification or survival report based on the data file obtained as a result from the Selection of attributes part. Currently, due to the limited computing power of our services, MAINE Generate report(s) application does not accept data files with more than 500 columns (attributes).
In case of Classification Report, in addition to the selected attributes, this file needs to include a Decision column which indicates the most important class. If the option Perform optional survival analysis is selected, then this file also have to provide Survival time and Survival status columns.
In case of Survival Report, in addition to the selected attributes, this file needs to include Survival time and Survival status columns.
In this section the user can also submit an optional text file providing the information about the parameters that were used for attribute selection in Selection of attributes part of the MAINE application. If this file is submitted then this will be included into generated report.
Cross-validations setting section includes parameters which are used both during generation of classification and survival reports. In general, to create decision/survival trees, decision/survival rules and the variable importance ranking we use so-called exploratory data analysis approach, where the whole dataset is used to discover dependencies in analysed dataset. However, to verify generalization abilities of a particular method used for exploratory analysis we need to assess its predictive performance. In the MAINE application such assessment is based on the cross validation approach.
Cross-validation parameters that can set by the user are as follows:
Classification report settings consists of two parts.
Classification report generation settings section allows the user to provide the following information:
Optional, additional survival analysis section allows the user to provide parameter values that can be incorporated into the classification report if the Patient data file includes patient survival data. In such a case the classification report will also include survival curves for decision trees and decision rules.
Optional, additional survival parameters are as follows:
In most cases values of Status survival column name and Primary class value parameters correspond to the values Outcome column name and Positive value from the above Classification report generation setting section. However it is possible for the user to provide additional column only with survival data.
Survival report generation setting section is available if the user selects Survival report generation settings option on Generate report(s) part of MAINE application:
Exemplary data files can be found in Exemplary files tab on the MAINE website. We provide the exemplary data in two formats:
Full datasets includes the data that was used for analyses presented in the paper (Gruca at al, 2020). This dataset is a study of Acute Myelod Leukemia (AML) patients (Cancer Genome Atlas Research Network et al., 2013) and was downloaded from GDC Data Portal (Grossman et al., 2016). AML study includes samples from 200 adults with previously untreated de novo diagnosed AML, however because of technological failures and quality issues for some samples the dataset is completed for all platforms for all patients. Finally, after selecting patients that had measurements for all data types we are interested in, we obtained following data for 109 patients:
Illustrative (reduced) datasets. Since analysis of the full datasets can take up to several hours we also provide smaller, illustrative (reduced) datasets for the testing purposes. Each illustrative data file was created by adding attributes that resulted from full data analyses and then randomly selecting 15% of the rest of attributes. Please note that this dataset has no biological meaning and its sole purposed is to provide the MAINE users with data that they can use to be familiar with the web tool before the start their own analyses. Illustrative files include the following number of attributes: